Skip to Content

Winners and losers in Canada’s housing market

Canada Mortgage and Housing Corp. released a new forecast this week that was more bullish about Canadian prices, sales and construction than its prior forecast in May. But the national figures meld together very different markets from coast to coast. Here’s a regional breakdown of what CMHC is expecting.SaywardHillRd758-203_0

BRITISH COLUMBIA

Overview:

-Housing starts are expected to be relatively constant.

-The construction mix is forecast to shift toward more detached houses and fewer condos as the economy strengthens.

-Stronger economic and job growth should support demand, and resale market conditions are expected to remain balanced.

The numbers:

-CMHC now forecasts 27,500 homes will begin construction this year, followed by 27,900 next year. (It’s revised down this year’s number a tad – in May it was expecting 27,800 starts this year).

-The average price of a home is now expected to be $553,300 this year and $556,500 next. (CMHC revised these numbers up – in May it was expecting $550,400 this year and $552,300 next).

The Globe’s Real Estate Beat offers news and analysis on the Canadian housing market from real estate reporter Tara Perkins. Read more on The Globe’s housing page and follow Tara on Twitter @TaraPerkins.

Surprising Summer Sales for Victoria and Area Real Estate

The Victoria Real Estate Board today released its monthly report on real estate activity in the Victoria area for July 2014.

681 properties sold in the region in the month of July 2014, compared to 583 last year in July – an increase of nearly 17%. June 2014 saw 680 sales.

When compared with year-to-date sales in 2013, 2014 shows a 10% increase.Summer Picnic Wide Desktop Background

“I think the activity in July has surprised a few people,” Victoria Real Estate Board President Tim Ayres says. “Traditionally the summer market is slower than the spring, but numbers are tracking closely to March and April sales this year. Last year sales in July were 12% lower than in June – and June was the peak of the market in 2013. This year we see slightly more sales in July than in June. This is the first year since 2003 that July numbers have beaten June.”

The MLS® Home Price Index (HPI) benchmark value for a single family home in the Victoria Core area in July was $562,000 – 2% higher than last year’s average value for the same home – $550,900.

“I’m looking forward to August numbers. With the diverse inventory on the market, stable pricing and the reasonable interest rates,” adds President Ayres, “I think the busy sales season could last into fall.”

Victoria Real Estate Board President Tim Ayres is available for comment. More information on the July 2014 report and the MLS® HPI is available from the Victoria Real Estate Board.

About VREB – Founded in 1921, the Victoria Real Estate Board is a key player in the development of standards and innovative programs intended to enhance the professionalism and community standing of REALTORS®. More than 1,200 local REALTORS® are currently members of the Victoria Real Estate Board.

View our press release and summary here.

View our complete statistical package here.

Where are buyers coming from? Not where you might think!

Buyers+Origins+20130101+to+20131231_Page_1The Victoria Real Estate  Board recently released some interesting statistics on where buyers are coming from in our region.  I have personally seen a marked interest in both buying and selling with the Greater Victoria region in the past few weeks and months which leads me to believe that this is the start of a small, but moderate, upward trend with the predictions of more out of town buyers coming and choosing Victoria as their new home. I don’t believe we have seen this wave coming in yet, as it’s still off in the distance, but feel this is going to have a big tidal shift on these stats going forward!

Buyers’ Origins (All Buyers): January 1, 2013 – December 31, 2013

Buyer already living in Greater Victoria = 74.92%

Total BC buyers 88.69%

Buyer from Alberta = 5.17%

Buyer from Saskatchewan = 0.7%

Buyer from Manitoba = 0.39%

Buyer from Atlantic Canada = 0.46%

Buyer from Northern Canada = 0.2%
Total Canadian buyers 98.36%

Buyer from USA = 0.82%

Buyer from Europe = 0.32%

Buyer from Asia = 0.38%

Other = 0.12%
Total out of Canada buyers 1.64%

Strongest May for Home Sales Since 2007

Vancouver, BC – June 13, 2014.  The British Columbia Real Estate Association (BCREA) reports that a total of 8,729 residential sales were recorded by the Multiple Listing Service® (MLS®) in May, up 13.9 per cent from May 2013. Total sales dollar volume was $4.9 billion, an increase of 20.6 per cent compared to a year ago. The average MLS® residential price in the province rose to $565,233, up 5.8 per cent from the same month last year.

“Consumer demand was noticeably stronger last month, with unit sales posting their highest level for the month of May since 2007,” said Cameron Muir, BCREA Chief Economist. “Rock bottom mortgage rates are inducing many would-be home buyers to enter the market this spring.”

“With most BC markets now in balanced conditions, home prices are up in nine of 11 board areas,” added Muir.

During the first five months of the year, BC residential sales dollar volume was up nearly 26 per cent to $18.8 billion, compared to the same period last year. Residential unit sales were up almost 17 per cent to 32,894 units, while the average MLS® residential price was up 7.7 per cent at $571,648.

Spring Sales Continue to Rise in the Victoria Market

The Victoria Real Estate Board today released its monthly report on real estate activity in the Victoria area for May 2014.

714 properties sold in the region in the month of May 2014 compared to 659 in May 2013 – an increase of over 8% year over year. Compared to last month in April, there were 7.5% more sales.

victoria_spring_beaconhill

“We are pleased to see sales numbers continue to rise,” Victoria Real Estate Board President Tim Ayres says. “The last time we saw this many sales in a month was in 2010, which was also the last time we saw a busy market. The increase may be attributed to the extended period of low mortgage rates we are seeing, and to the great diversity of properties currently available. We saw 19 single family homes sell for over one million dollars this month, and we saw 29 single family homes sell for under $350,000. The market has something for every home buyer right now.”

In May 2013 the MLS® Home Price Index benchmark price for a single family home in Greater Victoria was $493,600. This year in May the benchmark home value reached $498,500 – a modest 1% increase year over year. The Peninsula benchmark home value saw a 0.7% increase while the Westshore saw a very minor decrease of 0.1%. Townhouses in Greater Victoria show the most noteworthy change with an increase of 4.2% year over year.

“We’re seeing a modest increase in property values overall in the Victoria area” adds President Ayres, “and the balanced conditions we talked about last month are still in place, which means a steady, predictable market.”

More information on the May 2014 report and the MLS® HPI is available here:  View our complete statistical package here.


Victoria Real Estate Market is on Track and Steady for Spring

The Victoria Real Estate Board today released its monthly report on real estate activity in the Victoria area for April 2014.

victoria_spring_beaconhill

664 properties sold in the month of April 2014, compared to 615 in April 2013 – an increase of nearly 8% year over year. Compared to last month in March, there were 15.5% more sales.

New inventory came on to the market; with almost 9% more new listings than last month, which creates more choice for buyers. And though the total inventory level was higher than last month, it was still 4% lower than this time last year – approximately 180 fewer listings.

“We’re at an interesting time of the year for local real estate; spring is traditionally a busy season and I think the market is headed in the right direction,” Victoria Real Estate Board President Tim Ayres says. “I think people are watching numbers closely to see where house values are going and where demand is headed. But people waiting for a large change are going to be disappointed, because we see a steady market. Pricing is stable, inventory is at a good level, and we’re in balanced market territory which is good for both buyers and sellers.”

Current MLS® Home Price Index benchmark prices were relatively flat across the region. Single Family homes on the Peninsula showed the largest change in benchmark price with a drop of 2% compared to last year, while the Westshore showed the largest increase with 1.2% compared to last year. Greater Victoria condo benchmark pricing was down 0.5% from last year, but the value in the same area for townhouses increased by 2.4%.

Victoria Real Estate Board President Tim Ayres is available for comment. More information on the April 2014 report and the MLS® HPI is available from the Victoria Real Estate Board.

About VREB – The Victoria Real Estate Board was founded in 1921 and since that time has been a key player in the development of standards and innovative programs aimed at enhancing the professionalism and community standing of REALTORS®. Formation of the Board grew out of the realization in the early part of the last century that there was a need to establish basic standards for those working in the real estate industry.

View our complete statistical package here.


No bubble trouble: Genworth’s predictions for the Canadian condo market

VictoriaSaywardHillTe738-303_0

Declining economic output and employment rates curbed growth in 2013, limiting demand for condos. Though with an improving economy, modest improvement is expected for 2014, lifting sales by about 2 per cent. Active condo listings dropped 9.5 per cent in 2013 and the report suggests a further 15 per cent drop is on the horizon for 2014 as sellers remain wary. As the market tightens, the median price should rise nearly 3 per cent. Condominium starts fell 16 per cent to 513 units in 2013 and are forecast to rise only slightly in 2014. Modest increases are expected between 2015 and the end of the forecast in 2018. But even then, starts are predicted to remain less than half of peak levels.

Read the Full Report here: http://news.buzzbuzzhome.com/2014/04/no-bubble-canadian-condo-market.html


7 Signs Of An Up-And-Coming Neighborhood

brownstonesLive in a town large enough for a time long enough, and you’ll undoubtedly be made privy to a story of the one that got away. The neighborhood that got away, that is – the neighborhood that all the locals saw as down for the count, pshawing away little sprouts of area upturn, until one day the formerly downtrodden district was teeming with new businesses, new residents, new life – and newly high property values, to the advantage of those few brave souls who decided to go all in before the place actually arrived.

Maybe you’re a first-time buyer trying to squeeze every iota of value out of your precious house hunting dollars, or you just love the prospect of being an early settler in your city’s Next Big Neighborhood. In any event, it can be daunting and even scary to try to figure out whether a neighborhood is up-and-coming or down-and-out. Home value increases are an obvious indicator, but by the time values are up it’s often too late to get in on the early advantage of buying in a neighborhood before it’s potential has been realized.

If you’re ready, willing and able to take on the challenge of buying in a diamond-in-the-rough type neighborhood, here are some signs to look for before property values shoot through the roof.

1. On-trend businesses are moving in.

In my neck of the woods, when a co-working space, a Whole Foods or a Blue Bottle coffee moves into the neighborhood, it’s a sign that the nature of things might be changing. This is just as true for small, local businesses that attract people with disposable income as it is for businesses that sell the basics with flair. In fact, most larger businesses do a fair amount of economic research and projections on the neighborhood before moving in. Watching big industry and business moves can be a great way to spot emerging areas with strong fundamentals way before you might otherwise be able to see them yourself.

2. Uber-convenient location in a land-affected metro.

If you live in a densely populated metro area – especially one that is coastal – or an urban setting with intense governmental restrictions on building, demand for homes will continue to grow as the population does, but the supply will remain somewhat limited. In many of these situations, neighborhoods that have been downtrodden but have very convenient proximity to employment centers, public transportation, freeways and bridges tend to be prime for whole-neighborhood remodeling in times of population growth or rapid real estate price rises in already-prime areas.

3. Downsides have an expiration date.

If there’s one major issue that has caused an area to be less desirable for decades, and that issue is being eliminated or ameliorated, it could set the neighborhood up for a turnaround. For example, striking crime decreases or a major employer moving into the area where none were before can spark a serious real estate renaissance in an area which has some of the other desirable features on this list.

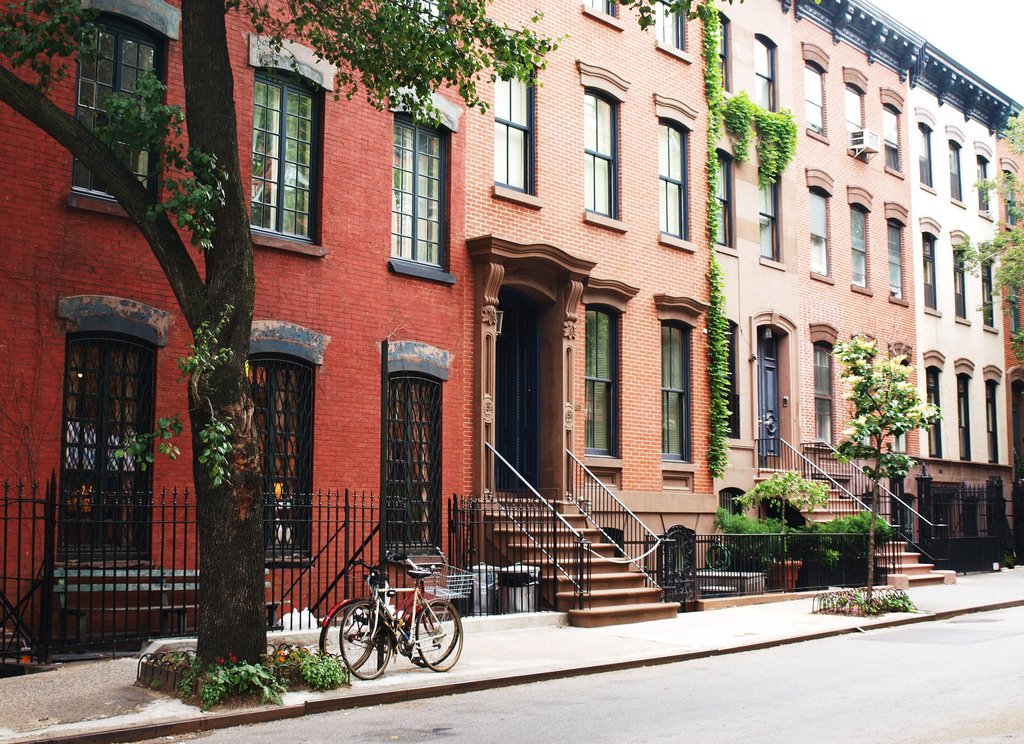
Also, keep in mind that a new generation of home buyers has a new set of values, and might simply not be concerned or deterred by things their parents might have viewed as turn-offs. Living above a commercial unit might have been a deal-killer for my parents, but my son thinks it’s cool – even desirable, depending on the business on the ground floor. Similarly, gritty and urban might not be the descriptors of your dream home, but some twenty-something first-time buyers in major metros are seeking exactly that feel.

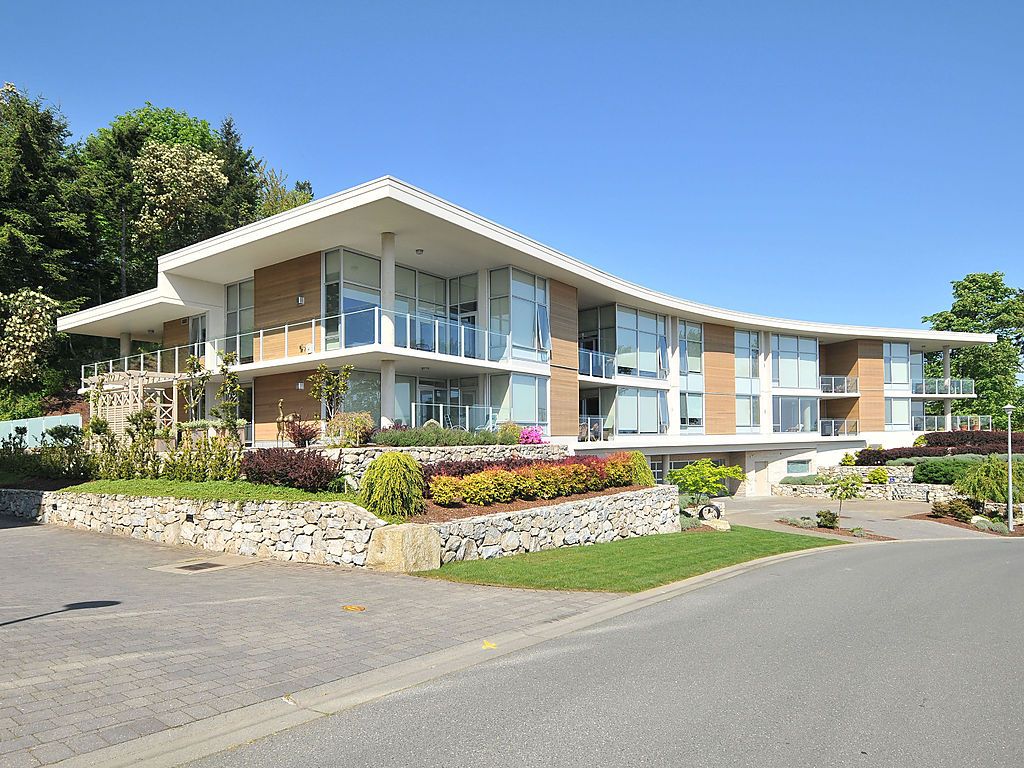
4. Architectural themes with a following.

Many up-and-coming neighborhoods find themselves pulled by aficionados of the particular type of architecture that characterizes the neighborhood. Often, down-at-the-heels neighborhoods that are riddled with Tudors, Victorians, Spanish-style homes or even Mid-Century Moderns will see a surge of revitalization when a fresh generation of frugal home buyers falls in love with the style and realizes the deals that can be had there vs. other, already prime areas in town.

5. At least one major economic development is brewing.

Never underestimate the power of a major economic development to overhaul a neighborhood’s fate. From Google and Microsoft building cloud storage data centers in Des Moines to a new light rail station going live in Denver, one large-scale employer or infrastructure development can be a very early, very strong sign that an area will see it’s real estate fortunes rise. (That said, areas dependent on one near-obsolete employer or industry can see their fates decline rapidly. Look for industrywide investment in an area, vs. a single company’s investment.)

6. Fixing is in the air.

When you see that an area long known for its rundown homes has a number of homes being renovated and rehabbed from the inside out, this can be a sign of fledgling neighborhood turnaround. If you spot these sorts of projects visually, it might be worth taking a trip down to the City Building Permit counter to see whether the staff has seen the same uptick in individual owners’ investment in the area, and if so, what they think the story of the neighborhood might be – or might become. City staffers often have a wealth of information at the ready, everything from pending commercial development applications that could change the whole landscape of an area to projects the city itself has funded or will prioritize due to its own development initiatives.

7. Slow but steady decrease in DOM.

Ten years ago, I listed a charming, pristine home on a not-so-charming, less-than pristine street – the location was its fatal flaw, and the place just lagged on the market as a result. Now, Millennials buying their first homes are salivating over that precise location, for its mix of urban feel; new trendy restaurants and yoga studios; and complete convenience to both the subway and the Bay Bridge. In between now and then, though, those who were watching carefully would have noticed how homes that once took 90 days to sell gradually were selling in 45, then in a couple of weeks – and would have noticed that this decline in the number of days an average listing stayed on the market (DOM) occurred way before the home prices themselves increased. A slow, steady decrease in DOM is a smart, early sign that a neighborhood might be poised on the precipice of up-and-coming status. Ask your agent to help clue you in as to where precisely those areas might be, in your town.

By Tara-Nicholle Nelson

This post originally appeared at Trulia. Copyright 2014.


Real Estate Activity Continues Ahead of Spring Market

VICTORIA BC – Real estate market activity in the first two months of 2014 remained slightly ahead of the same period in 2013.738 sayward

Total MLS® sales in February were 412, a 4.6 per cent increase over February 2013 when 394 units sold and a 20.5 per cent increase over the 342 sales reported to the Victoria Real Estate Board (VREB) in January 2014.

“It’s encouraging that sales activity continues to increase as we move towards a healthy spring market,” noted VREB President, Tim Ayres. “2013 spring sales were quite strong and we’re hoping for a similar level of activity this year.”

The MLS® HPI single-family home benchmark price for the entire Greater Victoria region was $483,400 in February, a 1.4 per cent decrease when compared to the February 2013 value of $490,100.

“With a $5 million condominium sale in February, it was no surprise to see average prices for condos rise last month from $328,130 to $373,749,” said Ayres. “Since the introduction of the MLS® Housing Price Index (HPI) in November 2013, we’ve been saying the HPI is a much more reliable measure of price trend data than average prices. Our February MLS® HPI numbers prove it; even with the $5 million sale, February MLS® HPI benchmark pricing for condos in Victoria remained virtually unchanged with an increase of only $400.”

At the regional level, the MLS® HPI benchmark price for the single family benchmark home in the Core municipalities was $547,800. This benchmark price is virtually unchanged when compared to both the previous month and February 2013. In Westshore, the MLS® HPI benchmark price for the single family benchmark home was $408,500, up 0.9 per cent from January 2014 and a 1.0 per cent decrease compared with last February. The MLS® HPI benchmark price for the single family benchmark home on the Peninsula was $502,600 for February, an increase of 1.1 per cent over the previous month and a 4.1 per cent decrease year-over-year.

There were 3,770 active listings at the end of February. While this is an increase from 3489 at the end of January, it is 7.4 per cent less than the 4072 listing that were available in February 2013. Inventory has been on a slow decline for most of 2013 but our normal cycle should result in more inventory as we move into Spring.

There were 107 condominium sales in February 2014, up from 92 in January and down from the 112 in February 2013. The region-wide MLS® HPI benchmark price in February for condos was $277,200, down 1.3 per cent from $280,800 from one year ago.

For townhomes, 42 sold in February compared to 30 in January and 43 in February 2013. The region-wide MLS® HPI benchmark price for townhomes was $401,500, up 1.4 per cent from $396,000 in February 2013.

Total Waterfront Single Family Dwellings sold: 8
Total Non-waterfront Single Family Dwellings sold: 219
Single Family Dwellings sold over $1 million: 15 (4 over $1.5 Million)

At the heart of the MLS® HPI is the concept of the “benchmark” home, a notional home that has the most common features of a typical home in a given area. The benchmark home does not represent any actual house, condo or townhouse, but merely provides an identical example to track changes in market value. There are separate benchmark houses, condos and townhouses in each distinct area of Greater Victoria, enabling the tracking of values on a variety of geographic levels.

For more information on the MLS® HPI benchmark prices and index values, visit www.vreb.org. Those requiring specific information on property values in their area should contact a REALTOR®. The Victoria Real Estate Board has more than 1,225 Members working more than 80 Brokerages.

View our complete statistical package here.

CMHC to Increase Mortgage Insurance Premiums

CMHC SCHL

OTTAWA, February 28, 2014 — Following the annual review of its insurance products and capital requirements, CMHC will increase its mortgage loan insurance premiums for homeowner and 1 – 4 unit rental properties effective May 1, 2014.

The increase applies to mortgage loan insurance premiums for owner occupied, self-employed and 1-to-4 unit rental properties, including low-ratio refinance premiums. This does not apply to mortgages currently insured by CMHC.

CMHC’s capital management framework is consistent with international practices and Canadian guidelines for mortgage insurers. Increased capital targets are consistent with Canadian and international industry trends and makes the financial system more stable and resilient.

“The higher premiums reflect CMHC’s higher capital targets” said Steven Mennill, CMHC’s Vice-President, Insurance Operations. “CMHC’s capital holdings reduce Canadian taxpayers’ exposure to the housing market and contribute to the long term stability of the financial system.”

For the average Canadian homebuyer requiring CMHC insured financing, the higher premium will result in an increase of approximately $5 to their monthly mortgage payment. This is not expected to have a material impact on the housing market.

Effective May 1st, CMHC Purchase (owner occupied 1 – 4 unit) mortgage insurance premiums will increase by approximately 15%, on average, for all loan-to-value ranges.

Loan-to-Value Ratio Standard Premium (Current) Standard Premium (Effective May 1st, 2014)
Up to and including 65% 0.50% 0.60%
Up to and including 75% 0.65% 0.75%
Up to and including 80% 1.00% 1.25%
Up to and including 85% 1.75% 1.80%
Up to and including 90% 2.00% 2.40%
Up to and including 95% 2.75% 3.15%
90.01% to 95% – Non-Traditional Down Payment 2.90% 3.35%

CMHC reviews its premiums on an annual basis and, going forward, plans to announce decisions on premiums in the first quarter of each year. The homeowner premium increase follows changes CMHC made to its portfolio insurance product earlier this year.

As Canada’s national housing agency, CMHC draws on more than 65 years of experience to help Canadians access a variety of quality, environmentally sustainable, and affordable housing solutions that will continue to create vibrant and healthy communities and cities across the country.

For additional highlights please see attached backgrounder and key fact sheet.